SPT SN-mass relation
User documentation
12/03/2012
- check the SN distribution of the values in filtered maps
- test on false detection rate
- SN-zeta relation check on high mass end clusters
- zeta-mass relation check
check the SN distribution of the values in filtered maps
The SN distribution on SZ-null filtered maps are perfect Gaussian.
The different colors represents different Rcore sizes filtered maps.
And the smooth curve is the Gaussian distribution.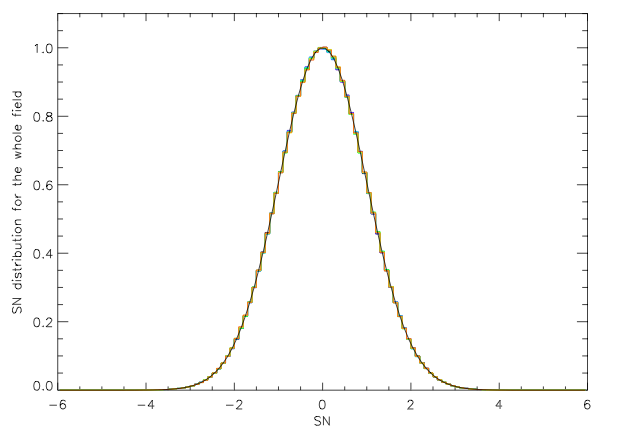
by sptmap/checksndistnull.pro
test on false detection rate
Check the false detection number density at different SN and Rcore.
Further estimate the relation for random match prediction.
Mock false rate based on 100 simulations (no Ysz signal from cluster)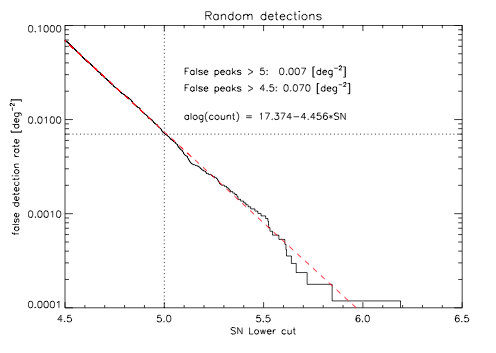
Mock fasle detection's Rcore distribution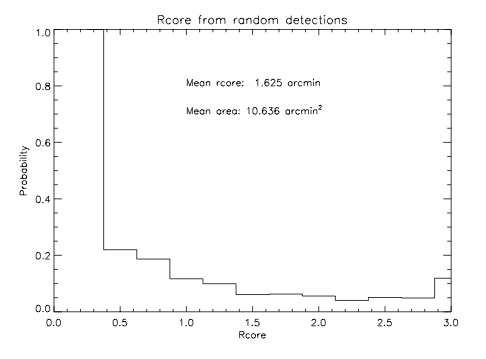
We have the estimation as:
SN > 5: 0.007 [deg^-2]
Mean area: 10.6 [arcmin^2]
use sptmap/checknull.pro to estimate the random matching rate
SN-zeta relation check on high mass end clusters
Check the clusters with mass > 8e14 -> 6 clustersThe SN error doesn't improve much. still 0.9
- Kurtosis / skewness are small (0.01 and -0.05)
- K-S test (fit sigma): 0.026767578 0.77794019
- K-S test (1-sigma): 0.025215746 0.83560780
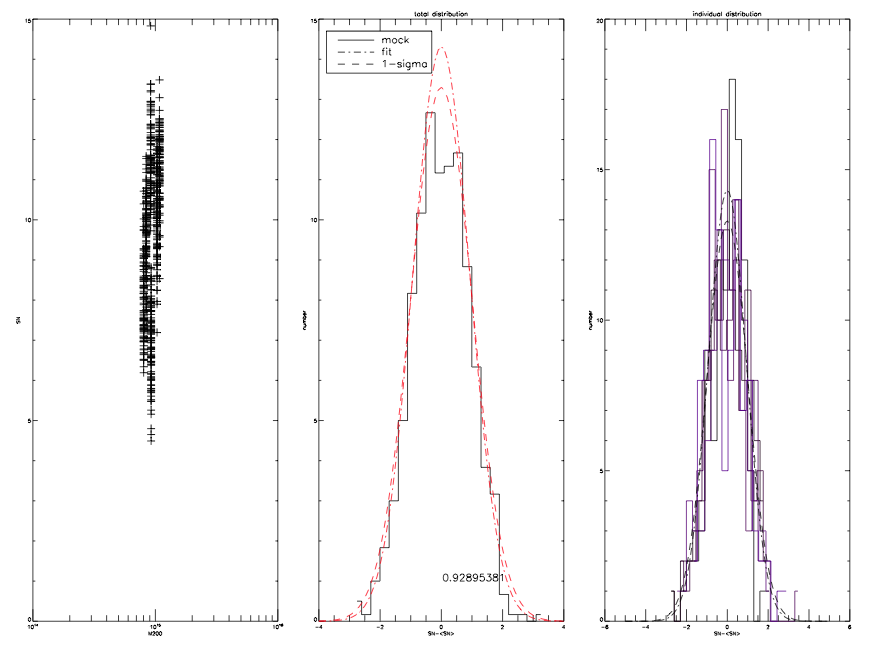
The SN error doesn't improve much. still 0.9
- Skewness / Krutosis : 0.013597445 0.030434153
- K-S test (fit sigma): 0.011321978 0.94951807
- K-S test (1-sigma): 0.030005940 0.044663965
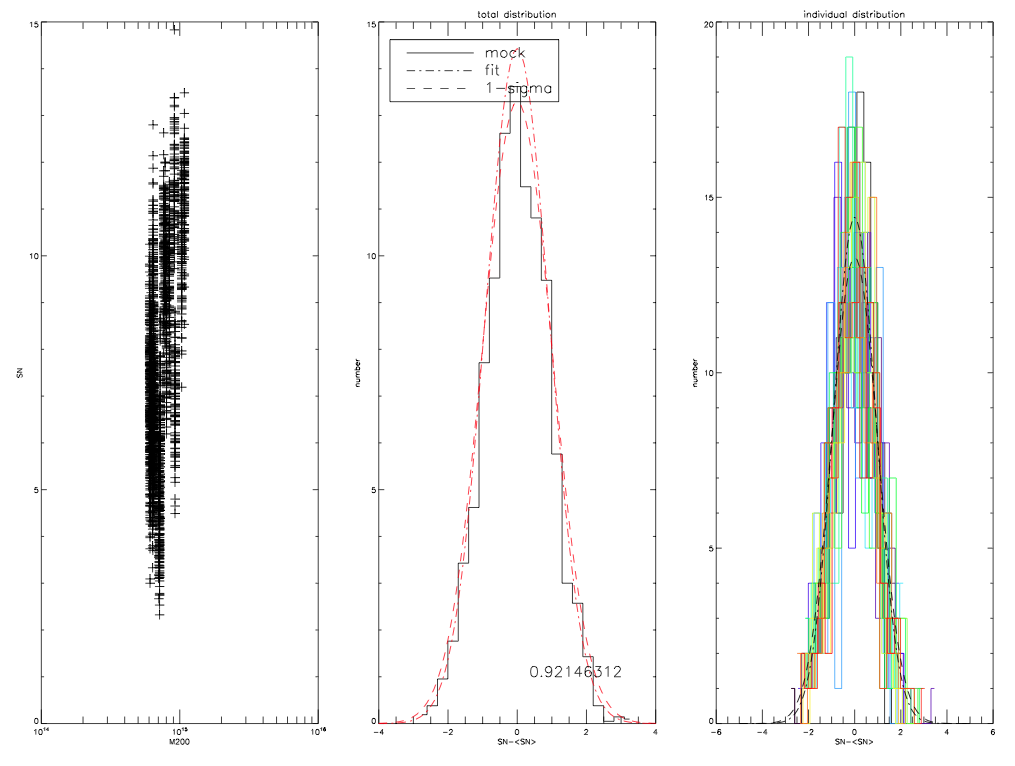
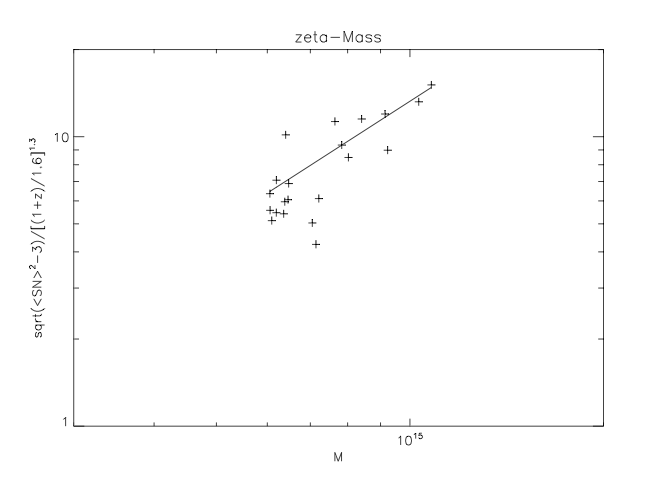
zeta-mass relation check
21 clusters with M > 6e14 Msun/h
scaling relation from V10:
Asz = 4.92
Bsz = 1.43
Csz = 1.6
